Real estate data for your area
Current month’s highlights and full data
March 2022 real estate highlights
Home prices in Boston were up nearly 25% at $1,175,000 in March, from $940,000 in February. The Boston area suburbs experienced a similar rate of increase when homes there rose from $880,000 to $1,070,000. Homes were also selling faster in both areas than the previous month as competition increases going into the warmer months. Inventory was flat in the Boston area, as well where 27 new homes were listed in March while 40 existing homes on the market were sold.
Competition report
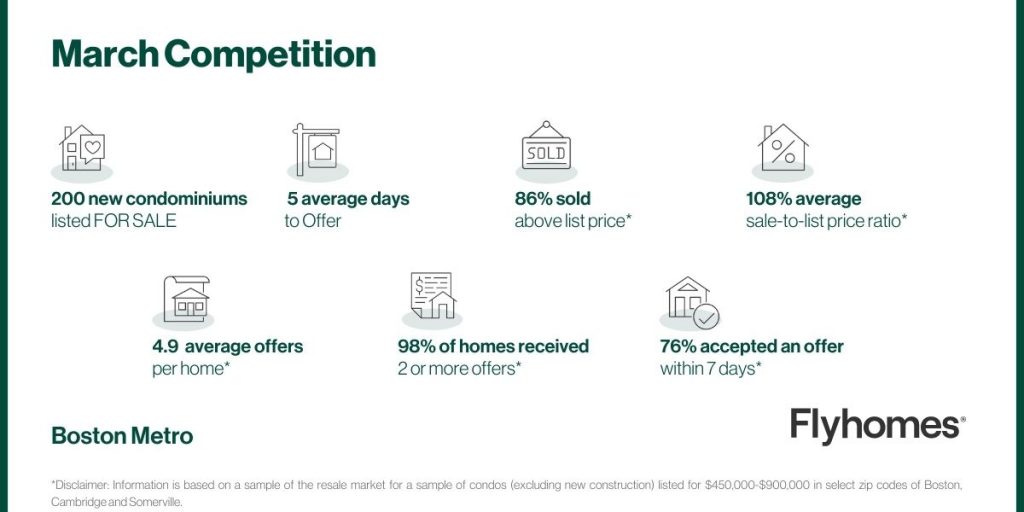
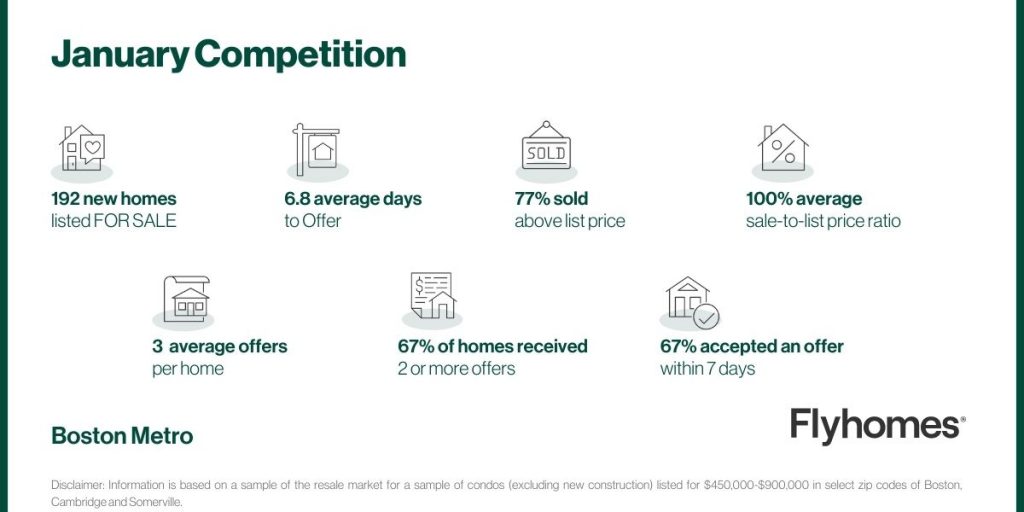
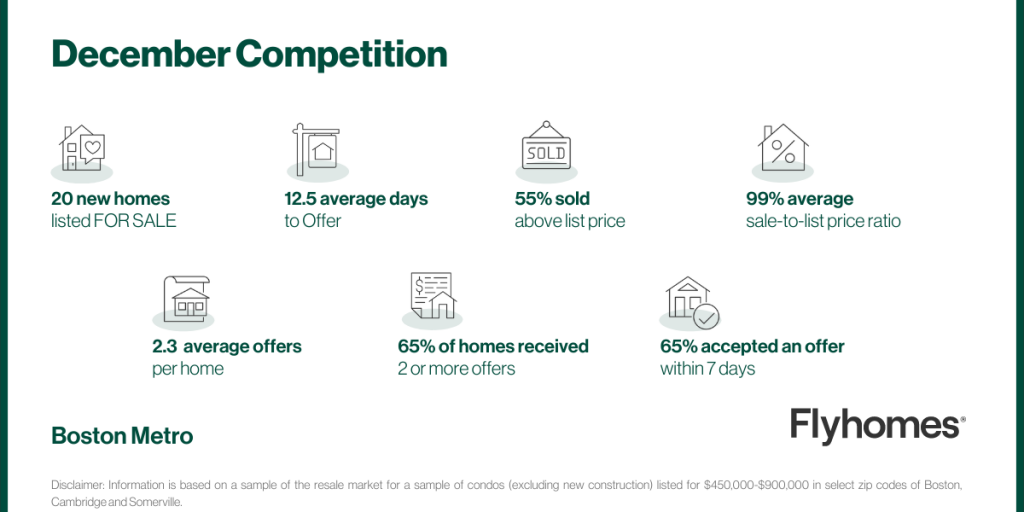
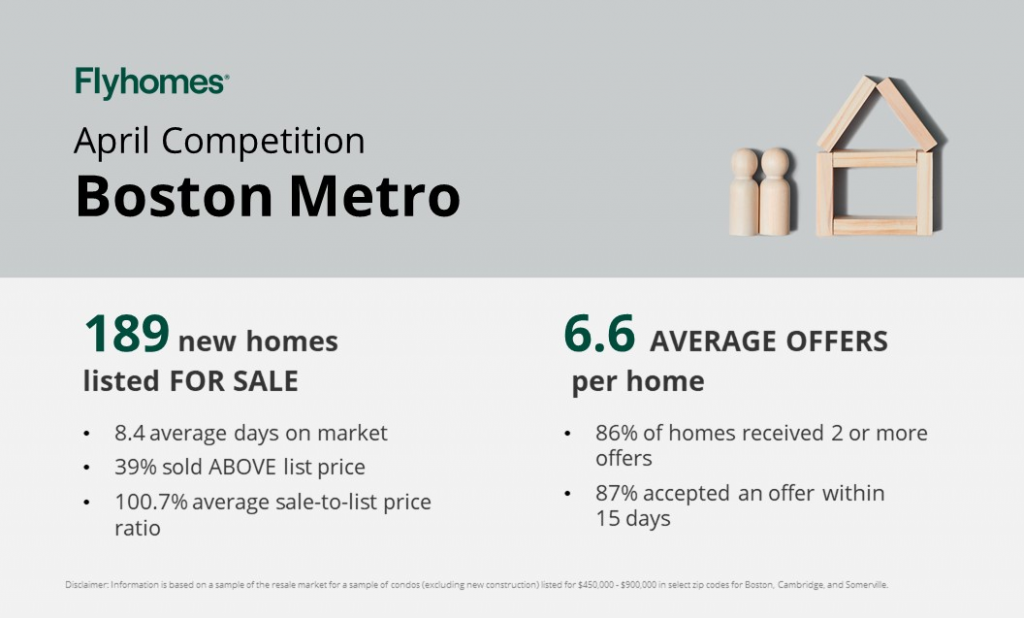
Our research team analyzed the competition in select local areas.

February 2022 real estate highlights
Following a predicted slow-down in the market at the end of last year, the housing market in Boston began to pick up again heading into the end of winter. Both single-family home and condo sale prices were up, bringing them closer in line to their list price. Meanwhile, single-family homes sold in half as much time in February as the previous month as inventory slid downward.
- Housing prices rose up to approach their previous peak At $1.2 million, houses in Boston were crept back up closer to their previous $1.4 million peak. This month’s increase was a nearly 13% increase from $1,150,000 in February.
- Homes sold almost as fast as they did during peak summer and autumn months last year At 22 days, the average days-on-market for single-family homes was almost as low as its previous low point of 21 days last October. This was a nearly 50% increase from 47 days the previous month.
- Condos were also selling quickly The average days-on-market for a condo in Boston plummeted from 70 to 21 in February. Competition for a condo increased due to lower inventory and a rising sale-to-list-price ratio.
- Sellers in the suburbs adjusted their listing strategy Sellers listed their homes for less than they did the previous month. In January, homes sold for below the list price so sellers adjusted downward to fall in line with a recovering sale price.
January 2022 highlights
The Boston housing market continued its dip into a slow winter season based on the analyses of a number of key metrics in list price, sale price, and inventory. For the most part, buyers were more empowered last month than sellers, but sellers showed optimism in the month before historical trends point to an increase. We’ll analyze the data here.
- Inventory increased as fewer homes were sold than listed Buyers listed more houses than they did the previous month following a spike in sale prices in December. But this led to an over saturated market in which more than 40 homes were listed but fewer than 30 were sold.
- Days on market decreased. Despite the high inventory and slightly higher list prices, homes in Boston were selling 35% faster than they did at the end of last year, at 35 days on average.
- Sale-to-list-price ratio was flat Home prices increases the sale-to-list-price ratio by only one percentage point so that homes were selling, on average, at 98% of their list price. This is consistent for yearly trends as this ratio tends to exceed 100% in the summer.

December 2021 highlights
Boston showed signs of a slight increase in the market’s overall price and competition heading into the new year. The number of homes listed dropped by over 50% while the number of homes sold stayed relatively even, causing a decrease to the inventory and an increase in the median sale price.
- Sale prices dipped below the median list price Buyers were purchasing homes in Boston for an average of 98% of the area’s list price. This followed a 1.5% dip in the list price from November.
- The amount of time a home was on the market spiked. Because of the dip in median sales price, sellers were holding out an average of 58 days in December before selling their home.
- Prices for Boston condos held steady from November The median selling price for a Boston condo was $750,000 in both November and December. Sellers tried to adapt by raising their median list prices, but that led to a wider gap between the sale and list price.

November 2021
November was the slowest month in the year, so far, as far as sales and price increase which reflects a leveling off of the market heading into the end of the year.
- Sale and list price caught up with each other. After a dip in October, the sale-to-list-price ratio crept back up to 101%. This is likely due to a slight increase in competition as fewer homes were placed on the market but the number of sales remained relatively stable.
- The amount of time a home was on the market spiked. Autumn in the Boston real estate market is a predictably slow time. One of the main indicators of this trend has been a large rise in the median days on market for single-family homes. The days on market for November rose 65% from 23 days to 38.
- The median sale price of condos dropped slightly. Median list prices for condos rose only $900 from $700,000 in November. But the sale price dropped to 98% of that list price, down to $750,000 from $784,000 the previous month.
October 2021
After a September jump in inventory, October brought a slowdown in Boston and the suburbs.
- Metro area condo listings returned to normal. The number of condos listed dropped 48% month over month after a huge leap in September. Because of the extra September inventory, sale-to-list price ratio stayed about flat while median days on market dropped 30% as buyers made quick decisions thanks to a wealth of options.
- Extra single family home inventory lowered sale prices in the city. The number of single family homes listed dropped 22% in October after leaping 150% in September. Those extra homes decreased competition as few buyers moved to purchase them. Sale-to-list price ratio dropped 3% month over month, days on market rose a whopping 70%, and median sale price fell 6%.
- Single family homes in the suburbs saw the lowest median sale price since February. Median sale price dropped 9% to $750,000 month over month, coming in 7% lower than in October 2020 and 47% lower than this year’s high of $1,100,000 in July. Meanwhile, the number of properties listed fell 22% month over month and the number pending jumped 24%.
September 2021
The median sale price of single family homes in Boston jumped 22%, but the increase isn’t an indication of a newly hot market or of true home value appreciation. An increase in the number of homes listed pumped up the median and sale price will likely return to its usual trend in October.
- Single family homes in the city sold unusually quickly. Boston single family homes sold in a median of 15 days, down 62% from August and significantly faster than August 2020 at 37 days and 2019 at 51 days. At the same time, the number of homes listed jumped 150%, indicating that more choices may have inspired buyers to purchase quickly. Sale-to-list price ratio fell 2%, showing that those buyers faced less competition than buyers since April.
- Boston condos sat idle. There’s a local trend for the number of condos listed to jump in September, and this year saw an increase of 131%. However, the abundance of inventory didn’t spur increased activity. The number of condos going pending rose only 5%, and sale-to-list price ratio and median days on market held steady.
- The suburbs saw more listings, but not more activity. While the number of single family homes listed increased 58% and condos jumped 71%, competition cooled as sale-to-list price ratio held steady. Previous years have seen a similar trend as the fall arrives, and it’s likely this year will continue to cool as the season progresses.

August 2021
August brought an expected seasonal decrease in activity to the Boston area, with sales slowing, less new inventory, and falling sale prices.
- Homes sold much more slowly. Single family homes in Boston saw median days on market rise 56% month over month and 86% year over year, reaching levels well above pre-pandemic norms. Condo sales also slowed significantly, rising 36% month over month and 11% year over year. While less dramatic, the suburbs saw corresponding increases.
- Sale prices reflect significant slowing except for city condos. In the city, median sale price for single family homes dropped 11% month over month, while condos held steady. The suburbs saw a larger drop for single family homes at 18%, with condos dropping 2%.
- Fewer homes were listed. Month over month, 31% fewer single family homes and 15% fewer condos were listed in Boston. In the suburbs, 25% fewer single family homes and 22% fewer condos were listed. August has historically seen a dip in the number of listings in the region, with a rise in September, so buyers might expect more selection on the market this month.

July 2021
While competition stayed well above previous years in July, we saw signs of seasonal slowing as we reached the backside of the summer peak.
- The city slowed down after a true peak in June. The number of single family homes listed dropped by 41% from June to July while condos fell by 42%. Meanwhile, sale-to-list price ratio remained about flat as the number of pending homes dropped by 22% for single family homes and 9% for condos. Median days on market rose 38% for single family homes and 44% for condos.
- The gap between sale and list price widened in the suburbs. Median sale price for single family homes in the suburbs continued an upward trajectory and rose 5% to a multi-year high of $1.1M. At the same time, list price dropped 6%, continuing a downward trend. Sellers are listing low while buyers purchase higher. We saw seasonal softening as days on market increased 20% for both single family homes and condos.
Competition snapshot

June 2021
The peak season is bringing small month-over-month changes, as the entire region is operating under a “new normal” with median sale prices outpacing the past two years.
- Condos in the metro area saw traction. The median sale price for condos in Boston fluctuated down 1% but, at $775,000, remains up 8% year over year and hoevers above the June 2019 pre-pandemic level of $770,000. Days on market rose, but stayed in line with expectations at this peak time of year. The number of condos listed jumped 27% month over month and sale-to-list price ratio hopped up 1% to hit 100% for the first time in years.
- Single family home competition stayed high in the suburbs. Median sale price rose 6% to top $1M, a 27% year-over-year increase and 29% over the June 2019 median of $795,000. Median list price dropped 10%, indicating that sellers may be using a strategy of listing low to encourage competition that drives up sale price. At the same time, 22% more homes were listed month over month, indicating that not all homes hitting the market saw equal competition, but the best ones were very competitive and drove up the median numbers.
Competition snapshot

May 2021
The market reflects the peak season for competition with Boston condo prices increasing and buyers in the suburbs competing for all property types. Single family homes in the city experienced a decrease in overall competition but homes that saw offers brought in a sale-to-list price ratio of 102%, the first jump above 100% for the area since July of last year.
- Condo sales heated up. In Boston, median sale prices for condos increased 4% to $785,000. A similar 4% rise for suburban condos landed at $647,500. Meanwhile, single family home prices stayed flat in the suburbs and decreased -3% in Boston.
- Single family homes in Boston saw decreased competition overall. While Boston single family homes pending increased 52% month over month, the increase was due to leftover April listings on the market. New listings increased by only 2%. Median days on market decreased 8%. However, sale-to-list price ratio rose to 102% (from 99%), showing that the homes that received offers saw strong competition.
- Buyers in the suburbs faced competition. Both single family homes and condos in the suburbs saw decreases in the number of new listings available. Median days on market fell 7% to 14 days for single family homes and stayed flat at 18 days for condos. Sale-to-list price ratio increased 1% for single family homes and 2% for condos, indicating multiple offer scenarios.
Competition snapshot

April 2021
The Boston area is experiencing increased competition in single family homes and continued activity in the suburbs.
- Prices are up for single family homes in the city. The median sale price for Boston single family homes jumped 51.0% month over month. List prices also increased 7.6% and the number of listings increased 30.3%, indicating that sellers are confident in the current market.
- Single family homes in the suburbs see high competition. Days on market held steady month over month at 15, a swift pace for the area, and -21.1% lower than the pre-pandemic April 2019 number of 19 days. Compared to pre-pandemic activity, April saw a similar number of homes listed compared to 507 in April 2019, but 13.8% more going pending compared to 382 in April 2019.
- Accordingly, suburban single family homes see rising prices. With sale-to-list price ratio at a multi-year high, and up 2.0% month over month and 4.5% year over year, buyers are competing for single family homes in the suburbs. Likewise, median list price increased 7.5% month over month, and 20.5% year over year and over two years (2020 and 2019 matched at $829,000).
Competition snapshot

March 2021
More buyers have entered the Boston-area market and some homes are seeing high levels of competition.
- Suburban homes are more expensive and more are selling. In the suburbs, median sale price for single family homes is up 12% year-over-year and the number of homes pending is up 69%.
- Some suburban homes are staying on the market much longer than the median. The number of single family homes listed is up year-over-year, but by a relatively small 19% compared to the 69% increase in the number of homes pending. This indicates that some of the homes going pending are inventory that has rolled over from previous months. Meanwhile, the median days on market is down 14% year over year to 15 days.
- More condos in the city are selling. The number of condos pending is up 81% year-over-year, while the number listed is up 68%. These properties are selling in a median of 28 days, which is slightly slower (17%) than last year’s median of 24 days.
Competition snapshot

February 2021
The Boston-area market has a distinct yearly pattern of decreased competition in fall and winter followed by a jump in spring and summer, and 2021 seems to be following suit.
- Sale prices are variable. Median sale price for condos in the metro area is up 6% month over month but down 3% year over year due to a February spike in 2020. In the suburbs, single family home median price dropped 7% month over month but rose 3% over this time last year.
- List prices are following trend. In the city, median condo list price was flat throughout 2020 and that trend continued through February with a 1% month-over-month increase. The suburbs saw a 21% month-over-month jump for single family home median list price, following the 2020 trend for this time of year.
- Homes are selling under list price, as is typical. Condos in the metro area also saw relatively flat sale-to-list price ratio throughout 2020 and have been following the same trend in the first months of 2020, staying at 95%. We can expect this to fluctuate throughout the year but stay under 100%. In the suburbs, the single family home ratio is up 3% year over year to 99%, indicating higher-than-usual competition for February.
- Expect city condo sales to speed up. Median days on market for Boston condos are up year over year, widening the gap that we saw at the end of 2020. It’s typical in the city for the year to start off with homes selling slower and then stabilize at a faster trend in the spring and summer, so we expect to see a month-over-month drop in March as demand increases. In the suburbs, single family homes saw median days on market drop to 17 days from 41 in January.
Competition snapshot

January 2021
The Boston area market started 2021 slightly slow, but an increase in activity is indicated for February.
- City condo prices continue a trend. While single-family median home price dropped 21.32% month over month, that dip is likely due to the small number of homes sold rather than a drastic increase in competition. Condos saw a median sale price drop of a relatively small 9.27% paired with almost flat days on market month-over month, following a usual trend of slowness in December and January. Typically, competition increases in February.
- City condo inventory may be growing. Month over month, the number of condos listed increased 122.41% while the number pending shrunk by 32.71%. Taken together, this could be a sign that there is some softening in the condo market–more are available, but fewer are selling. February will be a telling month.
- Suburban prices jumped. Both single-family homes and condos saw increased median sale prices month over month and year over year. Likewise, list price increased as is expected at the start of the year.
Competition snapshot

